


 29 / 40

27
Financial highlights
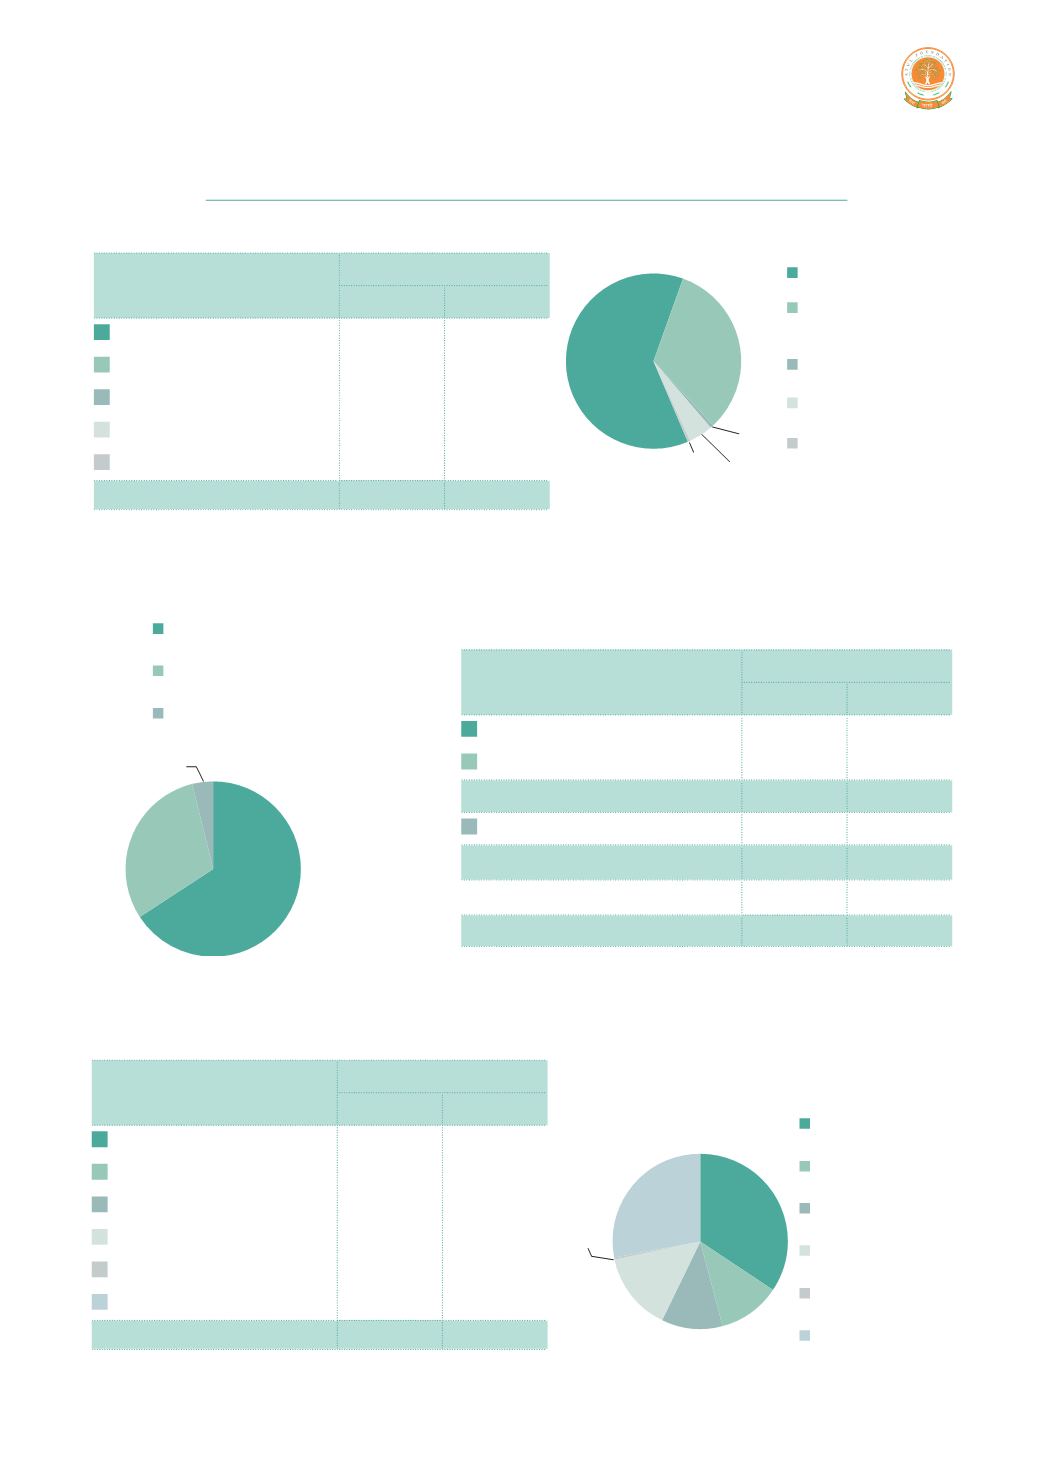
Where the monies came from
Particulars
Amount received
`
lakhs
%
Companies
1,345.13 61.84%
Government grants
710.08 32.65%
Donation (others)
13.37 0.61%
Interest income
96.11 4.42%
Miscellaneous income
10.34 0.48%
2,175.03 100%
On which programs the monies were spent
Particulars
Amount spent
`
lakhs
%
Education
789.32 34.34%
Empowerment
265.64 11.00%
Health
259.20 11.28%
Relief
333.12 14.49%
Infrastructure
8.93 1.00%
Conservation
642.06 27.94%
2,298.27 100%
Particulars
Amount used
`
lakhs
%
Programs
1,573.22 65.82%
Asset creation
725.05 30.33%
2,298.27
Administration
91.74 3.84%
2,390.01 100%
Spent from reserve balance
(214.98)
2,175.03
How the monies were used
66%
30%
4%
Programs
Asset creation
Administration
34%
12%
11%
15%
1%
28%
Education
Empowerment
Health
Relief
Conservation
Infrastructure
61.84%
0.61%
4.42% 0.48%
Companies
Government
grants
Donation (others)
Interest income
Miscellaneous
income
32.65%