


 16 / 140

Atul Ltd | Annual Report 2012-13
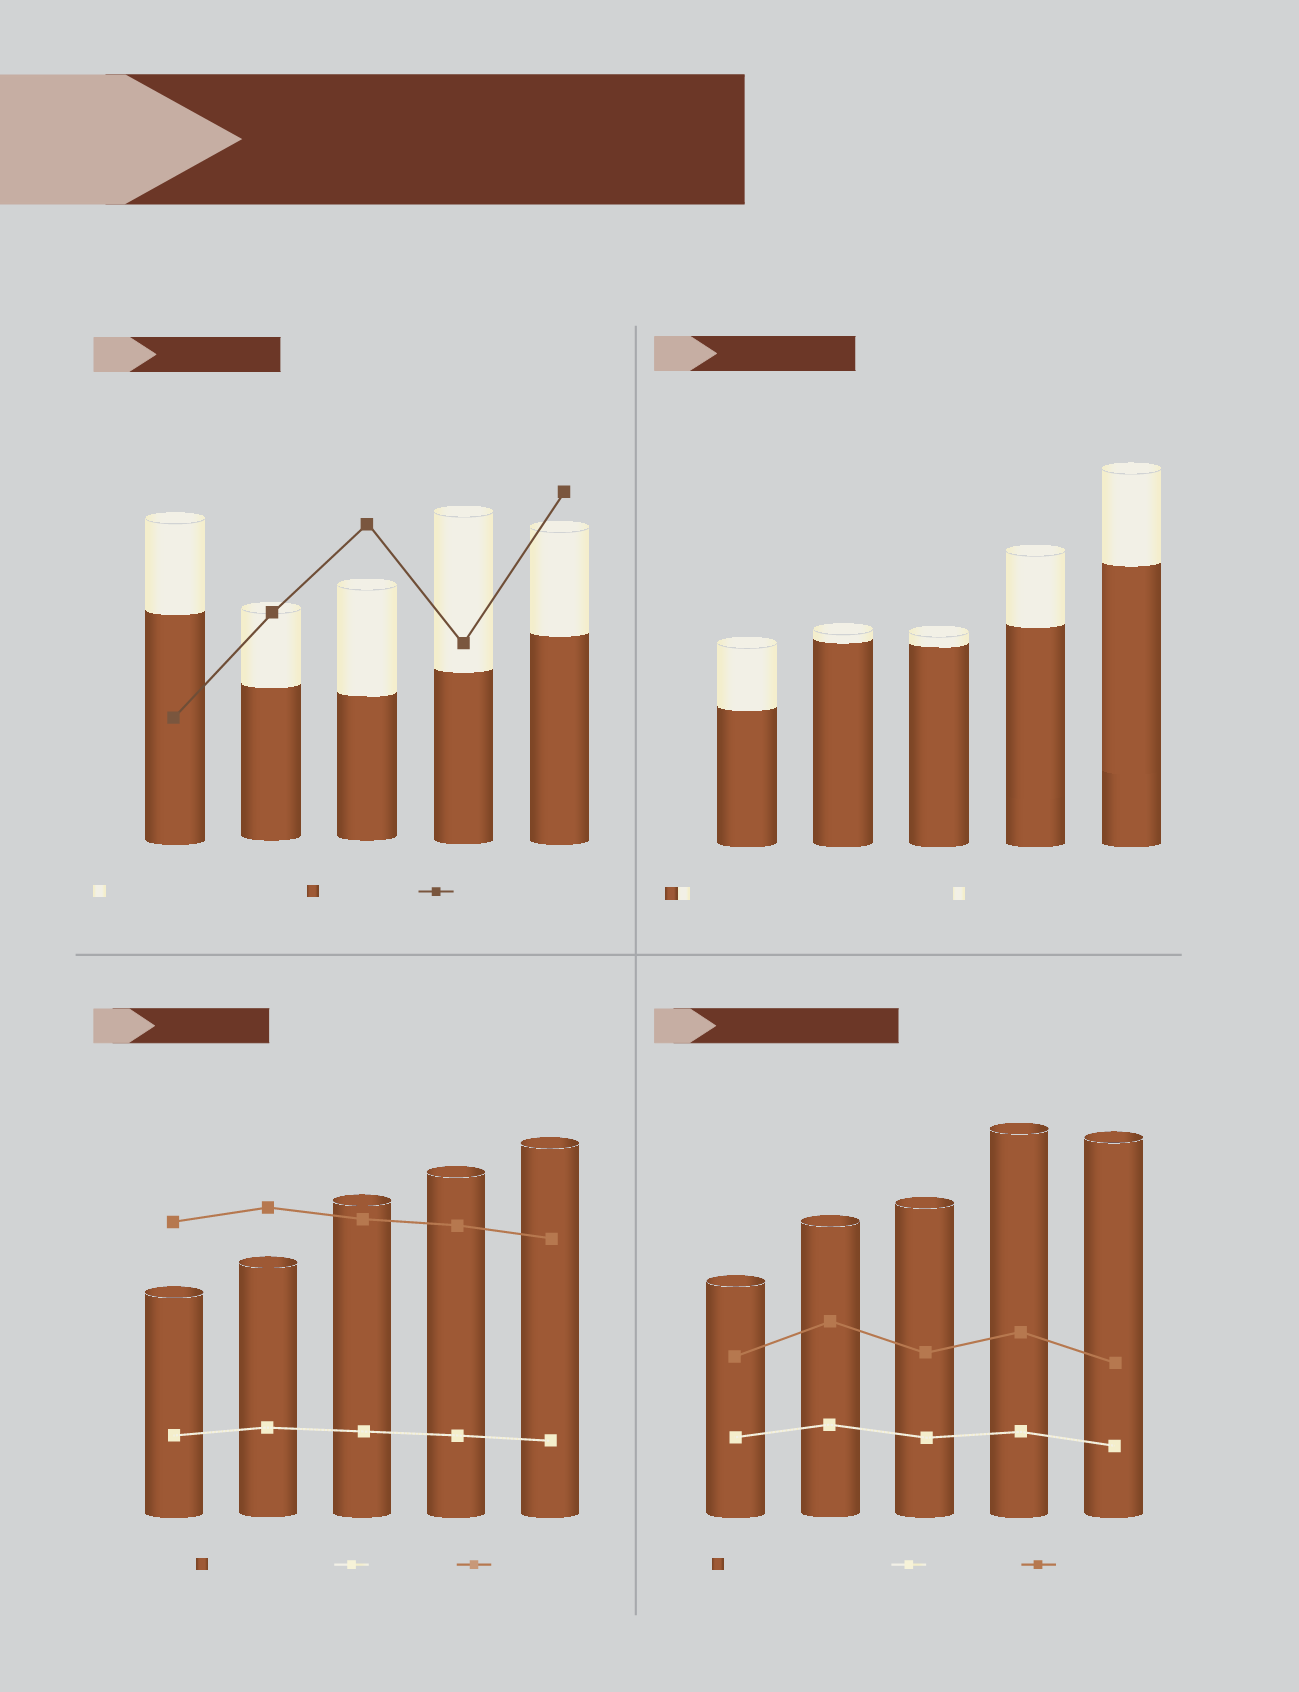
Borrowings
100
0
150
200
2
300
3
4
5
6
7
8
9
350
400
450
10
250
1
`
cr
3.0
8.2
4.7
7.5
5.5
88
142
112
80
65
288
230
215
240
267
2008-09 2009-10 2010-11 2011-12 2012-13
Rupee
Foreign currency
Interest coverage ratio
700
800
900
1,100
1,200
1,000
`
cr
79
114
22
25
92
951
974
972
1,044
1,156
859
949
950
965
1,042
2008-09 2009-10 2010-11 2011-12 2012-13
Additions during the year
Gross block excluding capital
work-in-progress
0
50
0
100
5
150
10
250
17.0%
18.1%
197
211
261
295
308
223
20
350
300
25
200
15
`
cr
%
2008-09 2009-10 2010-11 2011-12 2012-13
62
66
63
62
57
Inventories
NoDs
% to Sales
17.3% 16.9%
15.7%
0
50
0
100
10
150
20
250
223
271
300
368
362
223
40
400
300
350
50
200
30
`
cr
%
2008-09 2009-10 2010-11 2011-12 2012-13
66
79
68
71
62
Trade receivables
NoDs
% to Sales
19.2%
23.2%
19.9%
21.1%
18.4%
Fixed Assets
Trade Receivables
Inventories
Financial Charts