


 17 / 168

%
%
`
cr
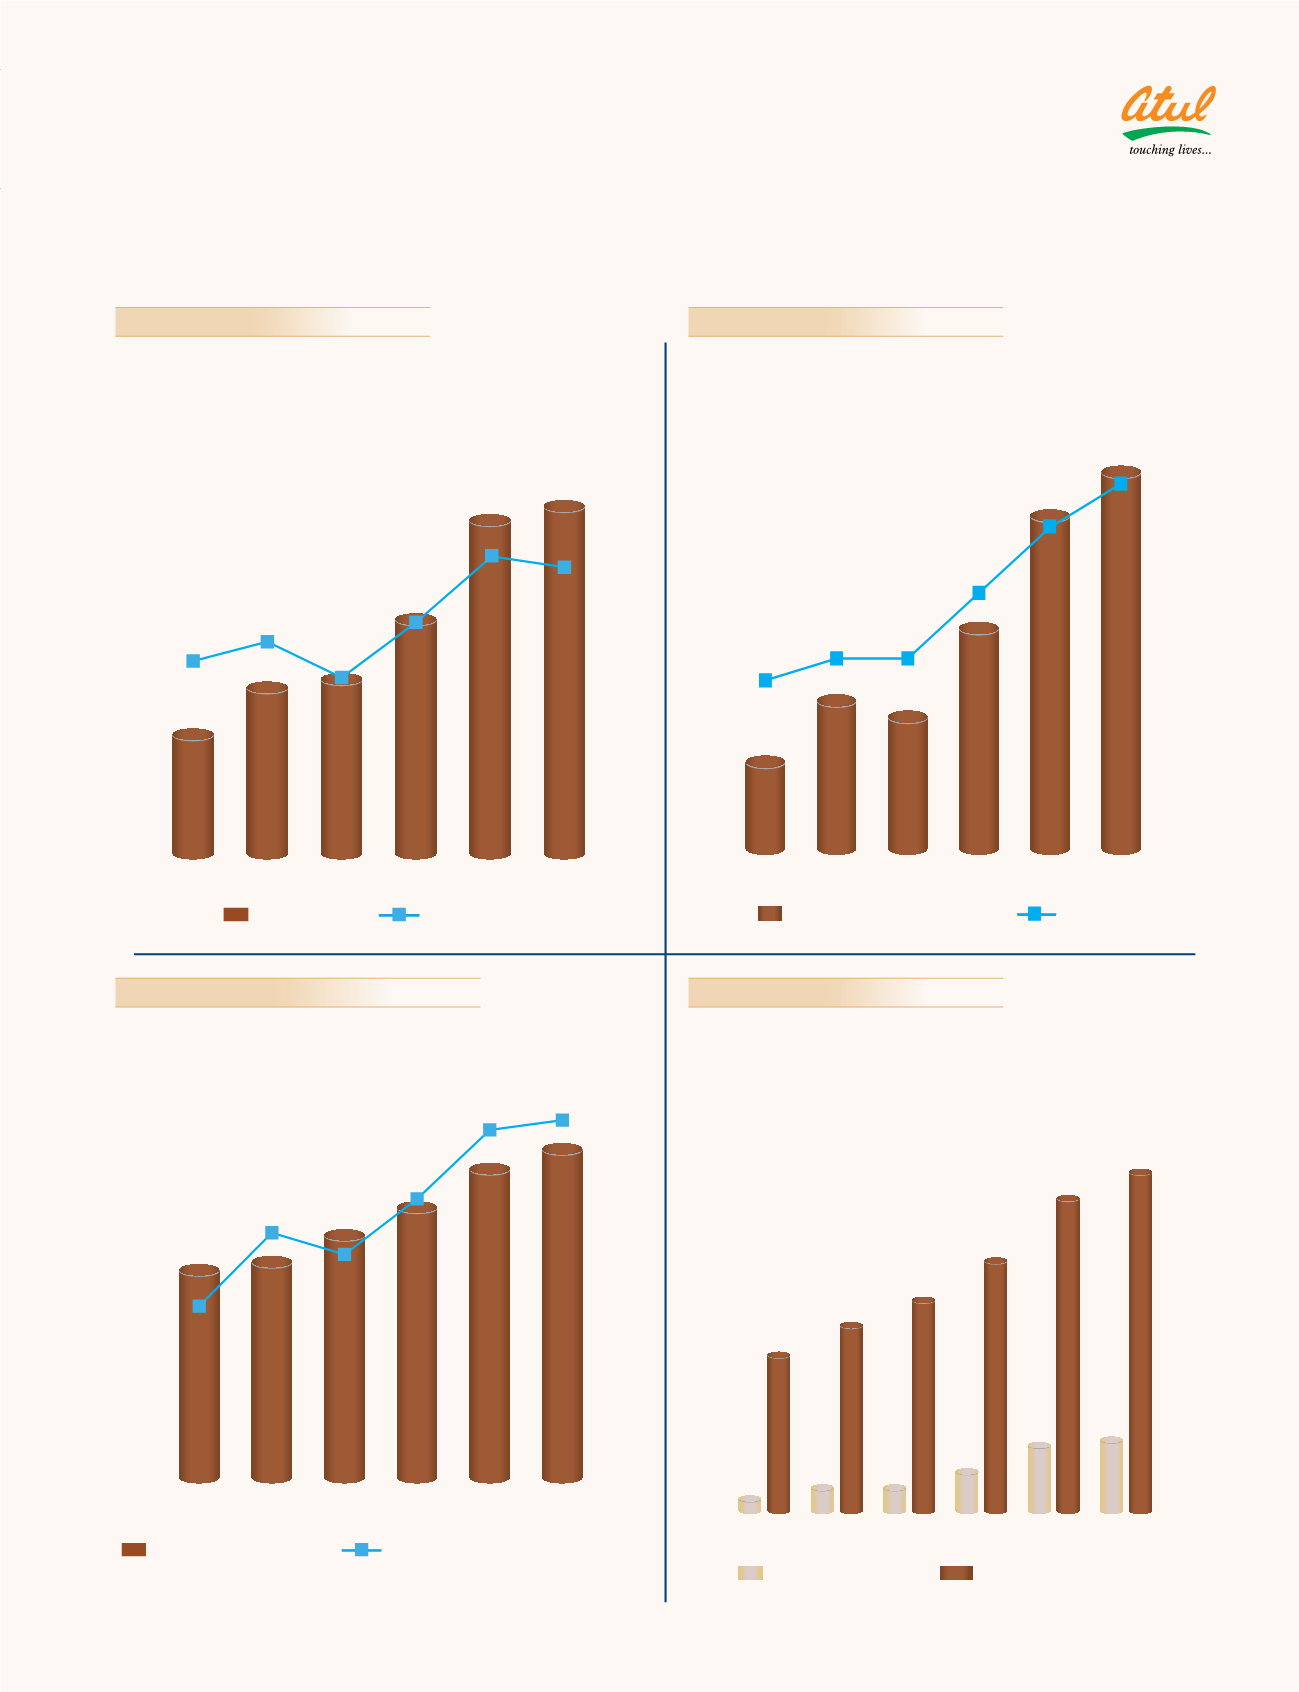
5 - year CAGR: 22%
`
cr
`
cr
5 - year CAGR
EPS: 31%
Book value: 16%
12.2%
12.9%
11.6%
13.6%
EBIDTA
EBIDTA %
2009-10 2010-11 2011-12 2012-13 2013-14 2014-15
0
50
100
150
200
250
300
350
400
450
5
8
11
14
17
20
143
194
203
268
362
391
15.6%
15.7%
0
300
600
900
1200
1500
0
5
10
15
20
25
30
810
13.1%
18.5% 16.9%
21.0%
26.0% 26.8%
840
939
1,041
1,183
1,256
Average capital employed *
Return on average capital employed %
#
*
2010-11
2009-10
2011-12 2012-13 2013-14 2014-15
* Excluding capital work-in-progress
#
Excluding exceptional | Non-recurring items
0
50
100
150
200
250
300
350
400
Earning per share
Book value per share
19
163
30
191
216
30
46
255
72
73
317
343
2010-11
2009-10
2011-12 2012-13 2013-14 2014-15
EBIDTA
Return on average capital employed
Earning per share and Book value per share
15
%
`
cr
5 - year CAGR: 31%
0
10
20
30
40
50
60
70
80
90
100
1,241
Dividend %
Pro t before tax from operations
2010-11
2009-10
2011-12 2012-13 2013-14 2014-15
0
50
100
150
200
250
300
350
80
129
116
187
277
312
85%
75%
45%
45%
40%
60%
Profit before tax from operations and Dividend