


 21 / 220

19
Dear Members,
The Board of Directors (Board) presents the Annual Report of Atul Ltd together with the audited Financial Statements for the
year ended March 31, 2018.
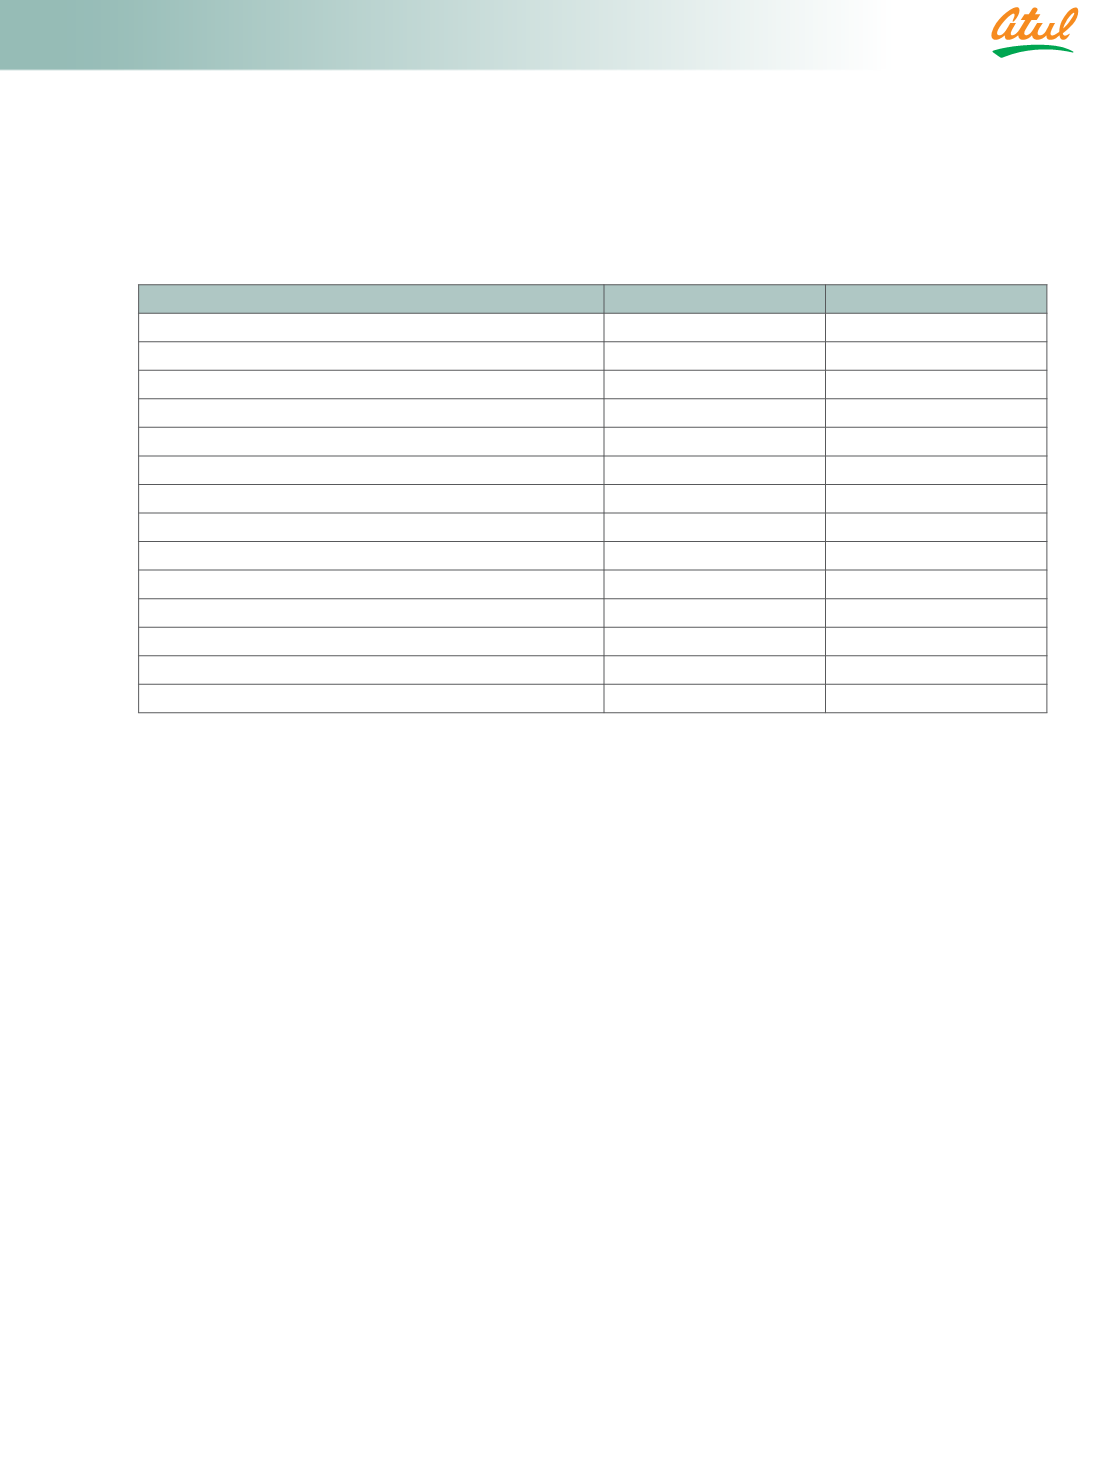
01.
Financial results
(
`
cr
)
2017-18
2016-17
Sales
3,050
2,639
Revenue from operations
3,148
2,848
Other income
38
43
Total revenue
3,186
2,891
Profit before tax
397
400
Provision for tax
127
115
Profit for the year
270
285
Balance brought forward
1,397
1,145
Transfer from Comprehensive Income
3
3
Disposable surplus
1,670
1,433
Less:
Dividend paid
30
30
Dividend distribution tax (net)
3
6
Balance carried forward
1,637
1,397
02.
Performance
Sales increased by 16% from
`
2,639 cr to
`
3,050 cr
mainly due to higher volumes (12%) and prices (4%).
Sales in India increased by 24% from
`
1,239 cr
to
`
1,536 cr. Sales outside India increased by 8%
from
`
1,400 cr to
`
1,514 cr. The Earnings per share
decreased from
`
96.18 to
`
91.16. Cash flow from
operating activities before working capital changes
marginally decreased by 1% from
`
485 cr to
`
480 cr
and the net cash flow from operating activities
decreased by 12% from
`
370 cr to
`
325 cr.
Sales of Life Science Chemicals (LSC) Segment
increased by 27% from
`
807 cr to
`
1,026 cr, mainly
because of higher sales in Sub-segments Crop
Protection and Pharmaceuticals; its EBIT decreased
by 8% from
`
130 cr to
`
120 cr. Sales of Performance
and Other Chemicals (POC) Segment increased by
10% from
`
1,832 cr to
`
2,024 cr mainly because
of higher sales in Sub-segments Aromatics - II and
Polymers; its EBIT decreased by 3% from
`
290 cr to
`
281 cr. More details are given in the Management
Discussion and Analysis (MDA) Report.
The Company fully repaid entire borrowings of
`
155 cr despite payment towards capital expenditure
of
`
114 cr during the year.
Credit Analysis and Research Ltd (CARE) maintained
its credit rating at ‘AA+’ (double A plus) for
long-term borrowings of the Company. Its rating
for short-term borrowings and commercial paper
remained at ‘A1+’ (A1 plus), the highest possible
awarded by CARE.
03.
Dividend
The Board recommends payment of dividend of
`
12 per share on 2,96,61,733 equity shares of
`
10 each fully paid up. The dividend will entail
an outflow of
`
42.91 cr {including dividend
distribution tax (net)} on the paid-up Equity share
capital of
`
29.66 cr.
04.
Conservation of energy, technology
absorption, foreign exchange earnings
and outgo
Information required under Section 134 (3) (m)
of the Companies Act, 2013, read with Rule 8 (3) of
the Companies (Accounts) Rules, 2014, as amended
from time to time, forms a part of this Report which
is given at page number 24.
05.
Insurance
The Company has taken adequate insurance to cover
the risks to its employees, property (land and buildings),
plant, equipment, other assets and third parties.
06.
Risk Management
Risk Management is an integral part of business
practices of the Company. The framework of Risk
Management concentrates on formalising a system
to deal with the most relevant risks, building on
existing management practices, knowledge and
structures. With the help of a reputed international
consultancy firm, the Company has developed and
implemented a comprehensive Risk Management
System to ensure that risks to the continued
existence of the Company as a going concern and to
its growth are identified and remedied on a timely
basis. While defining and developing the formalised
Risk Management System, leading standards
and practices have been considered. The Risk
Management System is relevant to business reality,
pragmatic and simple and involves the following:
Directors’ Report